Introduction and Code Download
Data in its raw form can often be misleading, hiding more than it reveals. Sometimes, the essence of information is obscured by the complexity or scale of raw data. This is where transforming the data becomes relevant. By applying a function \(f\) to each element in a set of samples \(\{x_1,\ldots, x_n\}\), in order to obtain the transformed dataset \(\{f(x_1), \ldots, f(x_n)\}\). Working with the transformed dataset might give different insights into the structure of the data and statics like the mean can put into the light some of this structure.
In general, transformations are essential tools in data analysis. They help in simplifying complex relationships, making the data more accessible for analysis. For instance, a logarithmic transformation can change a multiplicative relationship into an additive one, facilitating the detection of trends. This technique is not just limited to theoretical exploration; it finds practical application in various domains. For example, in image processing, transformations can enhance image quality, while in financial analysis, they can help stabilize the variance in time series data. As we proceed, this blog will explore both the theoretical aspects and practical applications of data transformation, highlighting the significant role of applying a function \(f\) in extracting meaningful information from data.
Code versions
A Little Bit of Theory
Even though the ways to transform data are virtually limitless, certain transformation methods have proven to be more useful and prevalent in practical applications [1]. These common transformations are not arbitrarily chosen; they are selected for their ability to simplify complex data relationships, making the data more amenable to analysis and interpretation. Some of these common transformations are:
Logarithmic Transformation: One of the most widely used transformations is the logarithmic transformation. It's particularly effective in dealing with data that exhibit exponential growth or a multiplicative relationship, such as certain financial or biological data. By converting multiplicative processes into additive relationships, logarithmic transformation can help in linearizing the data, making patterns more apparent and statistical analysis more straightforward. The logarithmic transformation is given by the formula: \[ y = \log(x).\]
Power and Exponential Transformations: Similarly, power transformations (like square or cube of data) and exponential transformations are frequently employed. Power transformations are useful in stabilizing variance and making data more symmetrical. These transformations are given by the formula \[y = x^p.\] On the other hand, exponential transformations can be ideal for data that vary exponentially, common in fields like population growth studies or radioactive decay analysis. In this case the formula for the transformation is \[y = \exp(x).\]
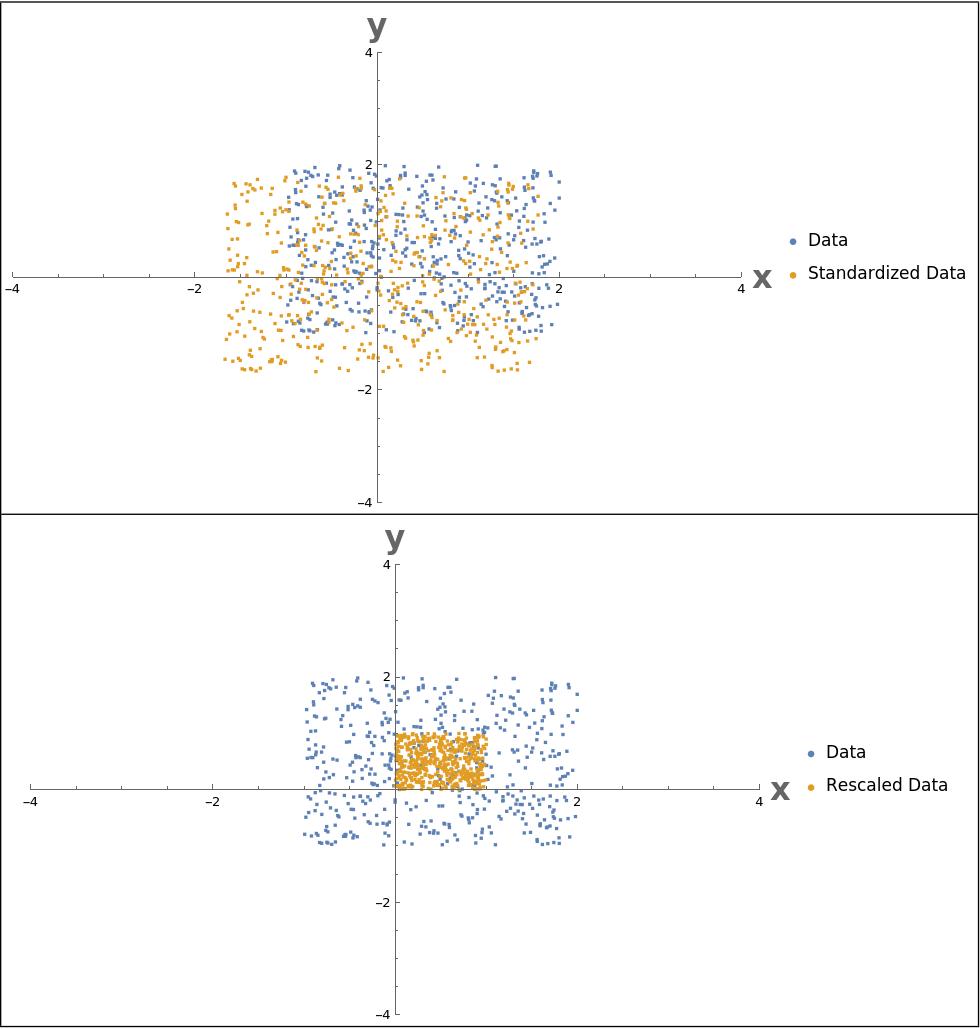
Standardization and Normalization: Standardization (converting data to have zero mean and unit variance) and normalization (scaling data to a fixed range) are also common, particularly in machine learning. These transformations are critical in ensuring that different features contribute equally to the learning process, preventing models from being skewed by features on larger scales. In this case if \(\mu\) and \(\sigma\) represent the mean and standard deviation of the samples we get for standardization \[y = \frac{x - \mu}{\sigma},\] and for normalization if \(m\) and \(M\) represent the minimum and maximum of the samples, then \[y = \frac{x - m}{M - m}\]
In Figure 1. we can see examples of data standardization (top) and normalization (bottom).
Applications
Below we have a list of applications of transforming the data and calculating the mean of the transformed data
- Image Noise Reduction: In digital image processing, applying a transformation like a logarithmic scale to pixel intensities before calculating the mean can significantly reduce noise, enhancing the clarity and quality of images [2].
- Economic Index Calculation: When creating composite economic indices, applying transformations to individual economic indicators before averaging them helps in normalizing the data, ensuring that each indicator contributes proportionately to the final index [3].
- Sports Analytics: Transforming player or team performance data before calculating the mean can provide a more nuanced understanding of performance trends, especially in cases where data distribution is not normal or has outliers [4].
References
Disclosure: Please note that some links in this post are affiliate links, and at no additional cost to you, Algothingy will earn a commission if you decide to make a purchase after clicking through the link. We recommend these references because of their quality, and not because of the commission Algothingy will receive from your purchases.
Stay Ahead with Algothingy

